kitchenmetrics-public

KitchenMetrics — Professional Cooking Suite
Food costing, frying safety and cooking-time science for professional kitchens.
Works fully offline · No accounts · No ads · No tracking · English / Italiano / Español
What it does
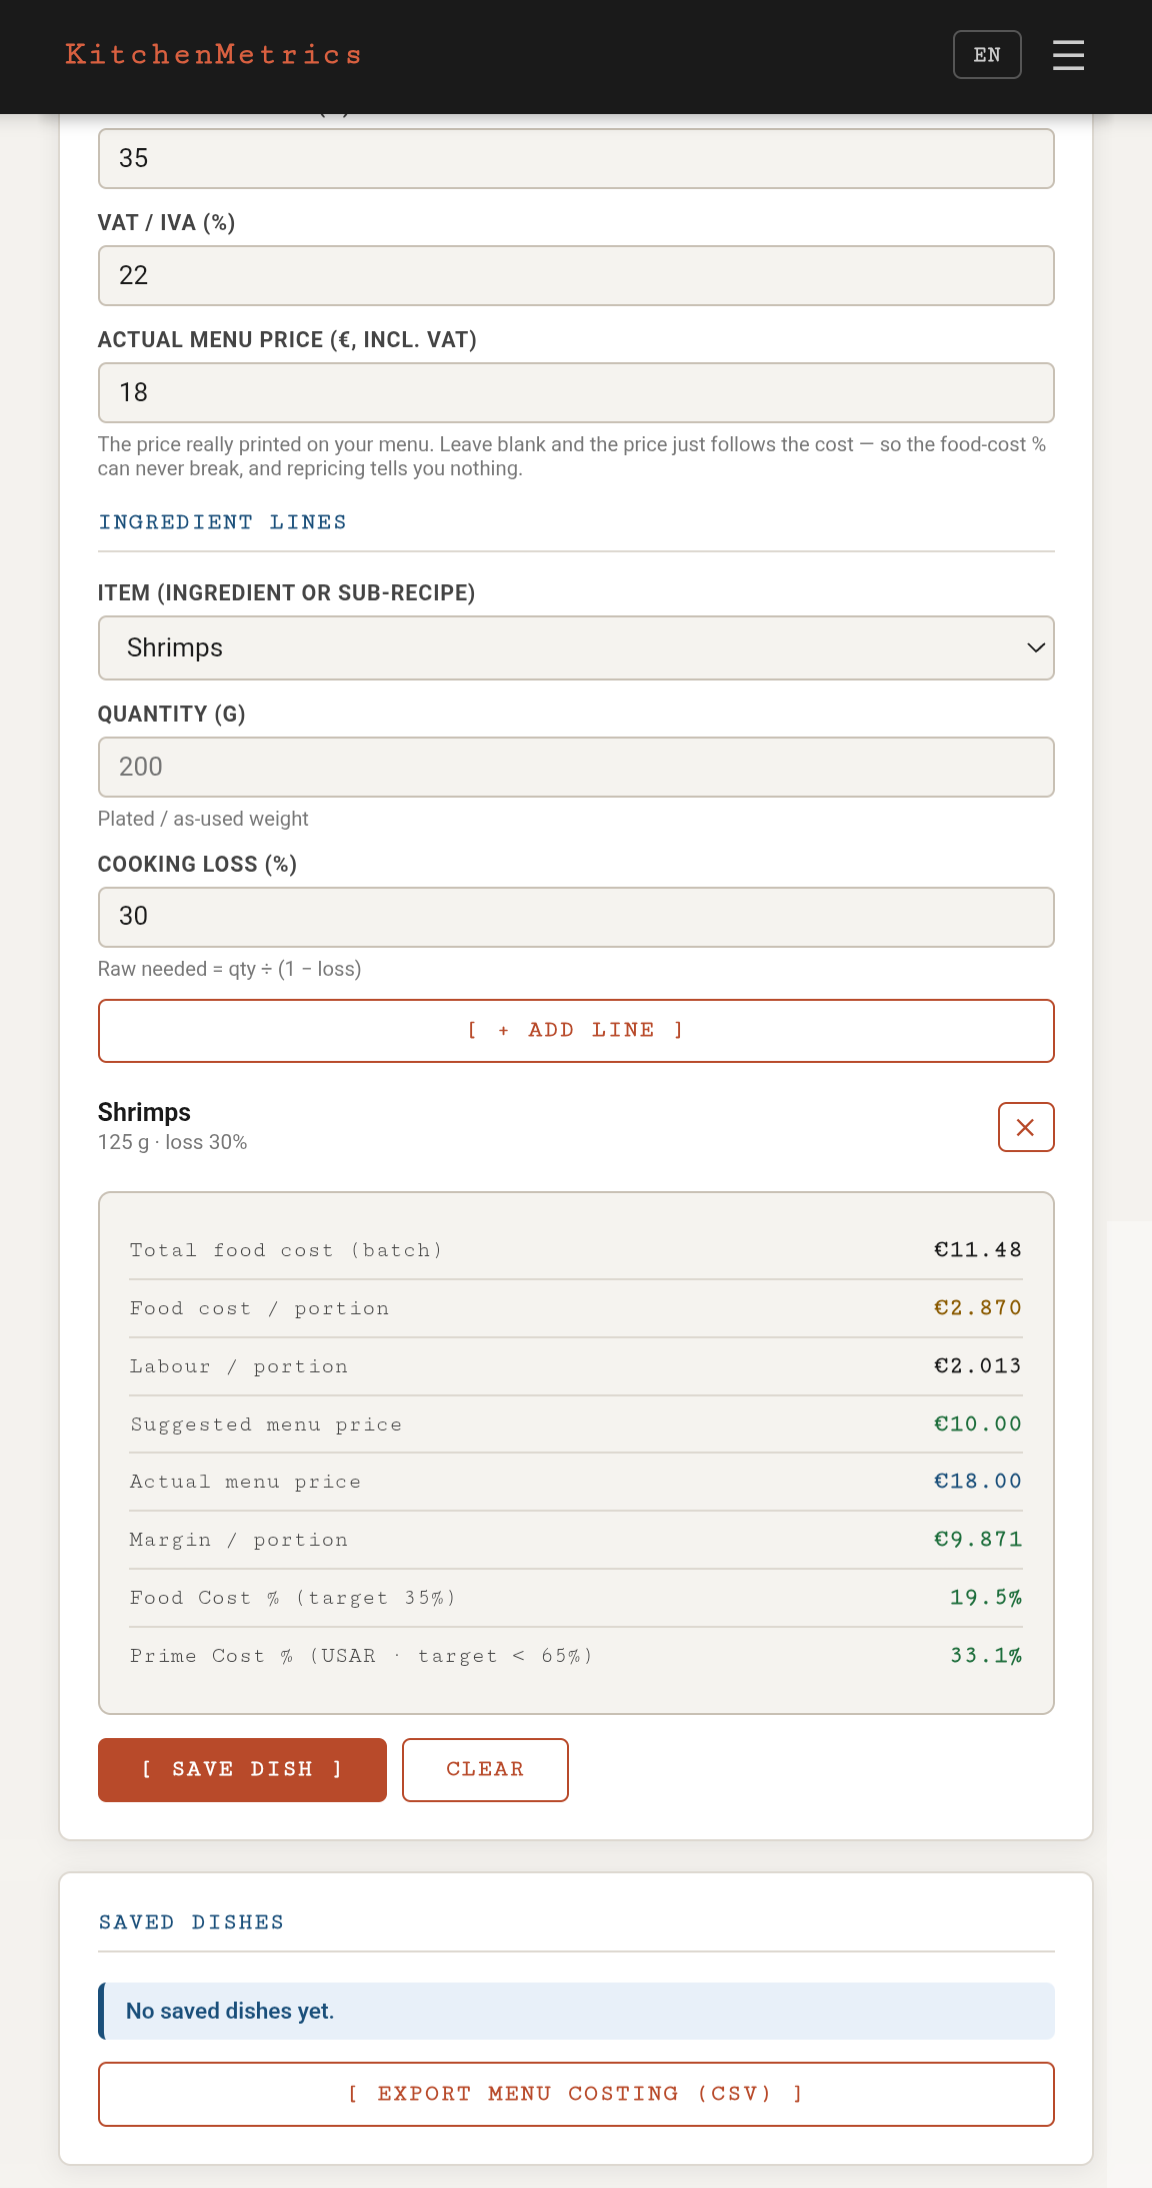
| Recipes & Menu Costing | Ingredient library with supplier prices and price history. Multi-line dishes, sub-recipes, saved dish library, and menu-wide repricing: “salmon went up 12% — which dishes break?” |
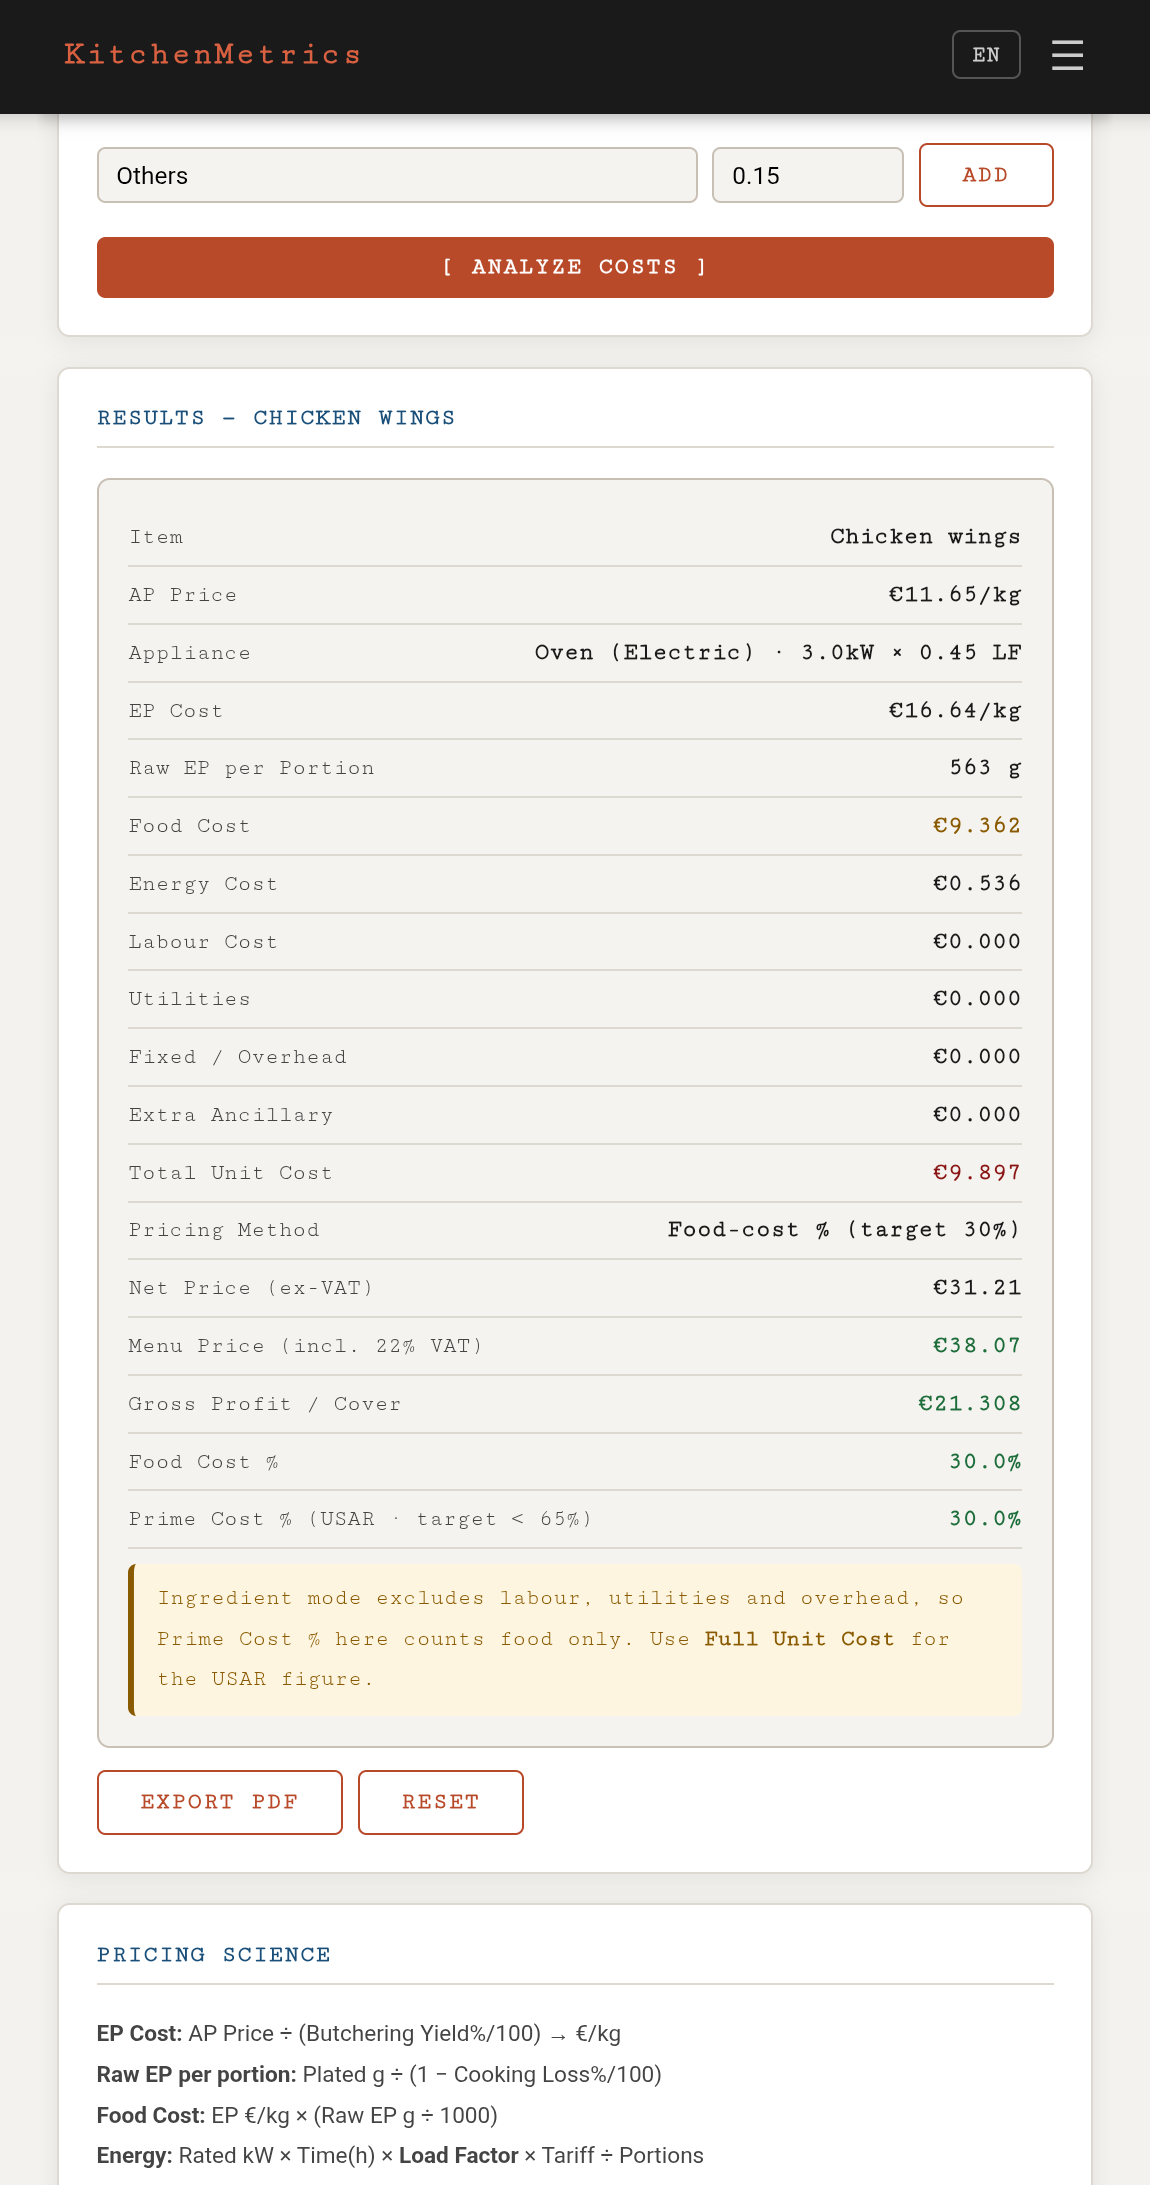
| Food Cost Calculator | EP cost, energy, labour, utilities, overhead and VAT. Reports Food Cost % and Prime Cost % against net revenue. |
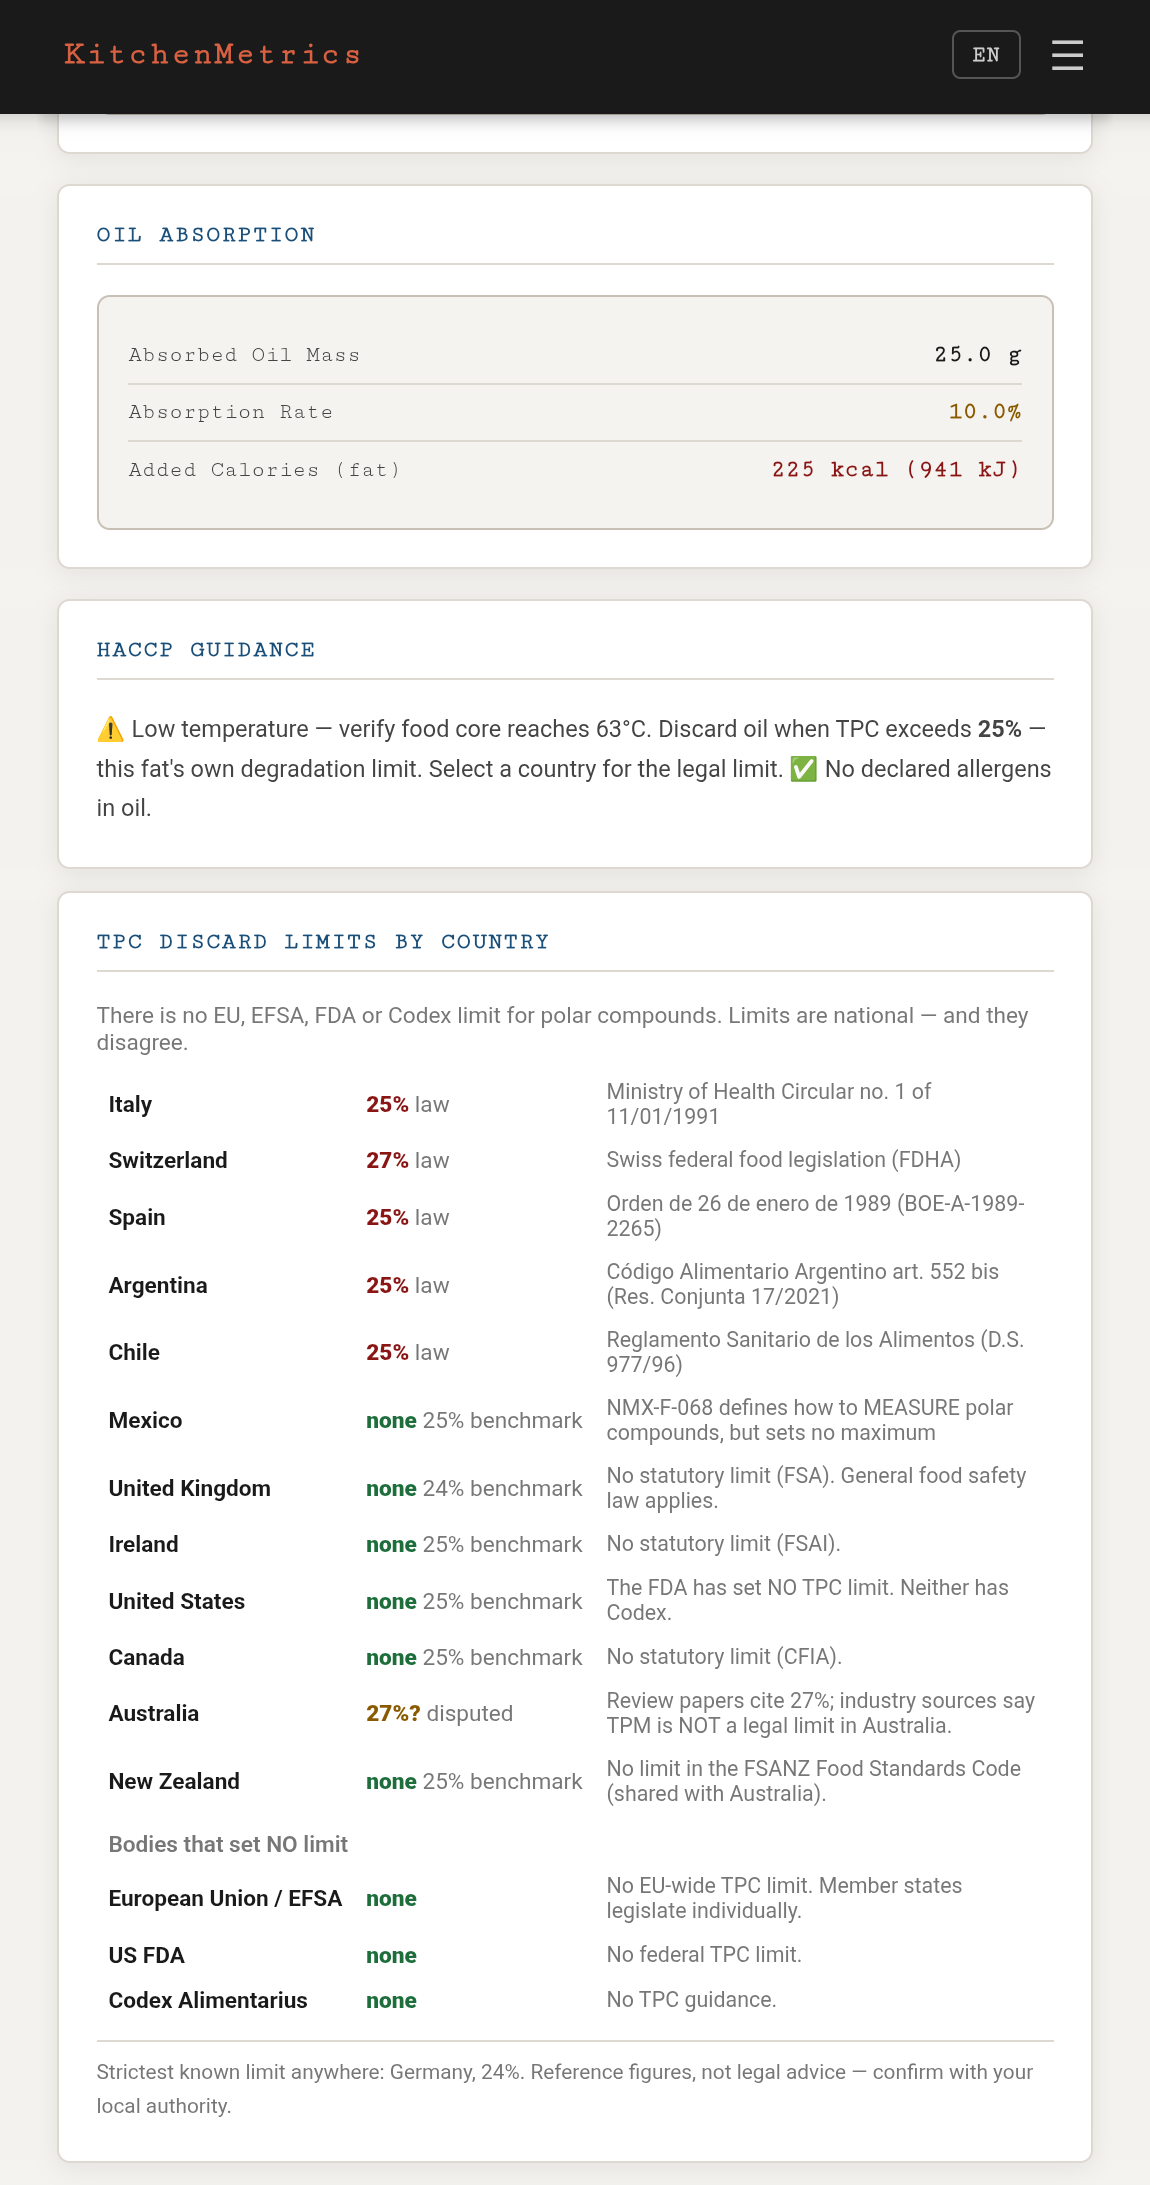
| HACCP Fryer Analyzer | TPC degradation, oil absorption and remaining oil life against the discard limit of the country you cook in — there is no EU, EFSA, FDA or Codex limit for polar compounds, and the national ones disagree (Italy and Spain 25%, Switzerland 27%, no legal limit at all in the UK, Ireland, the USA or Canada). |
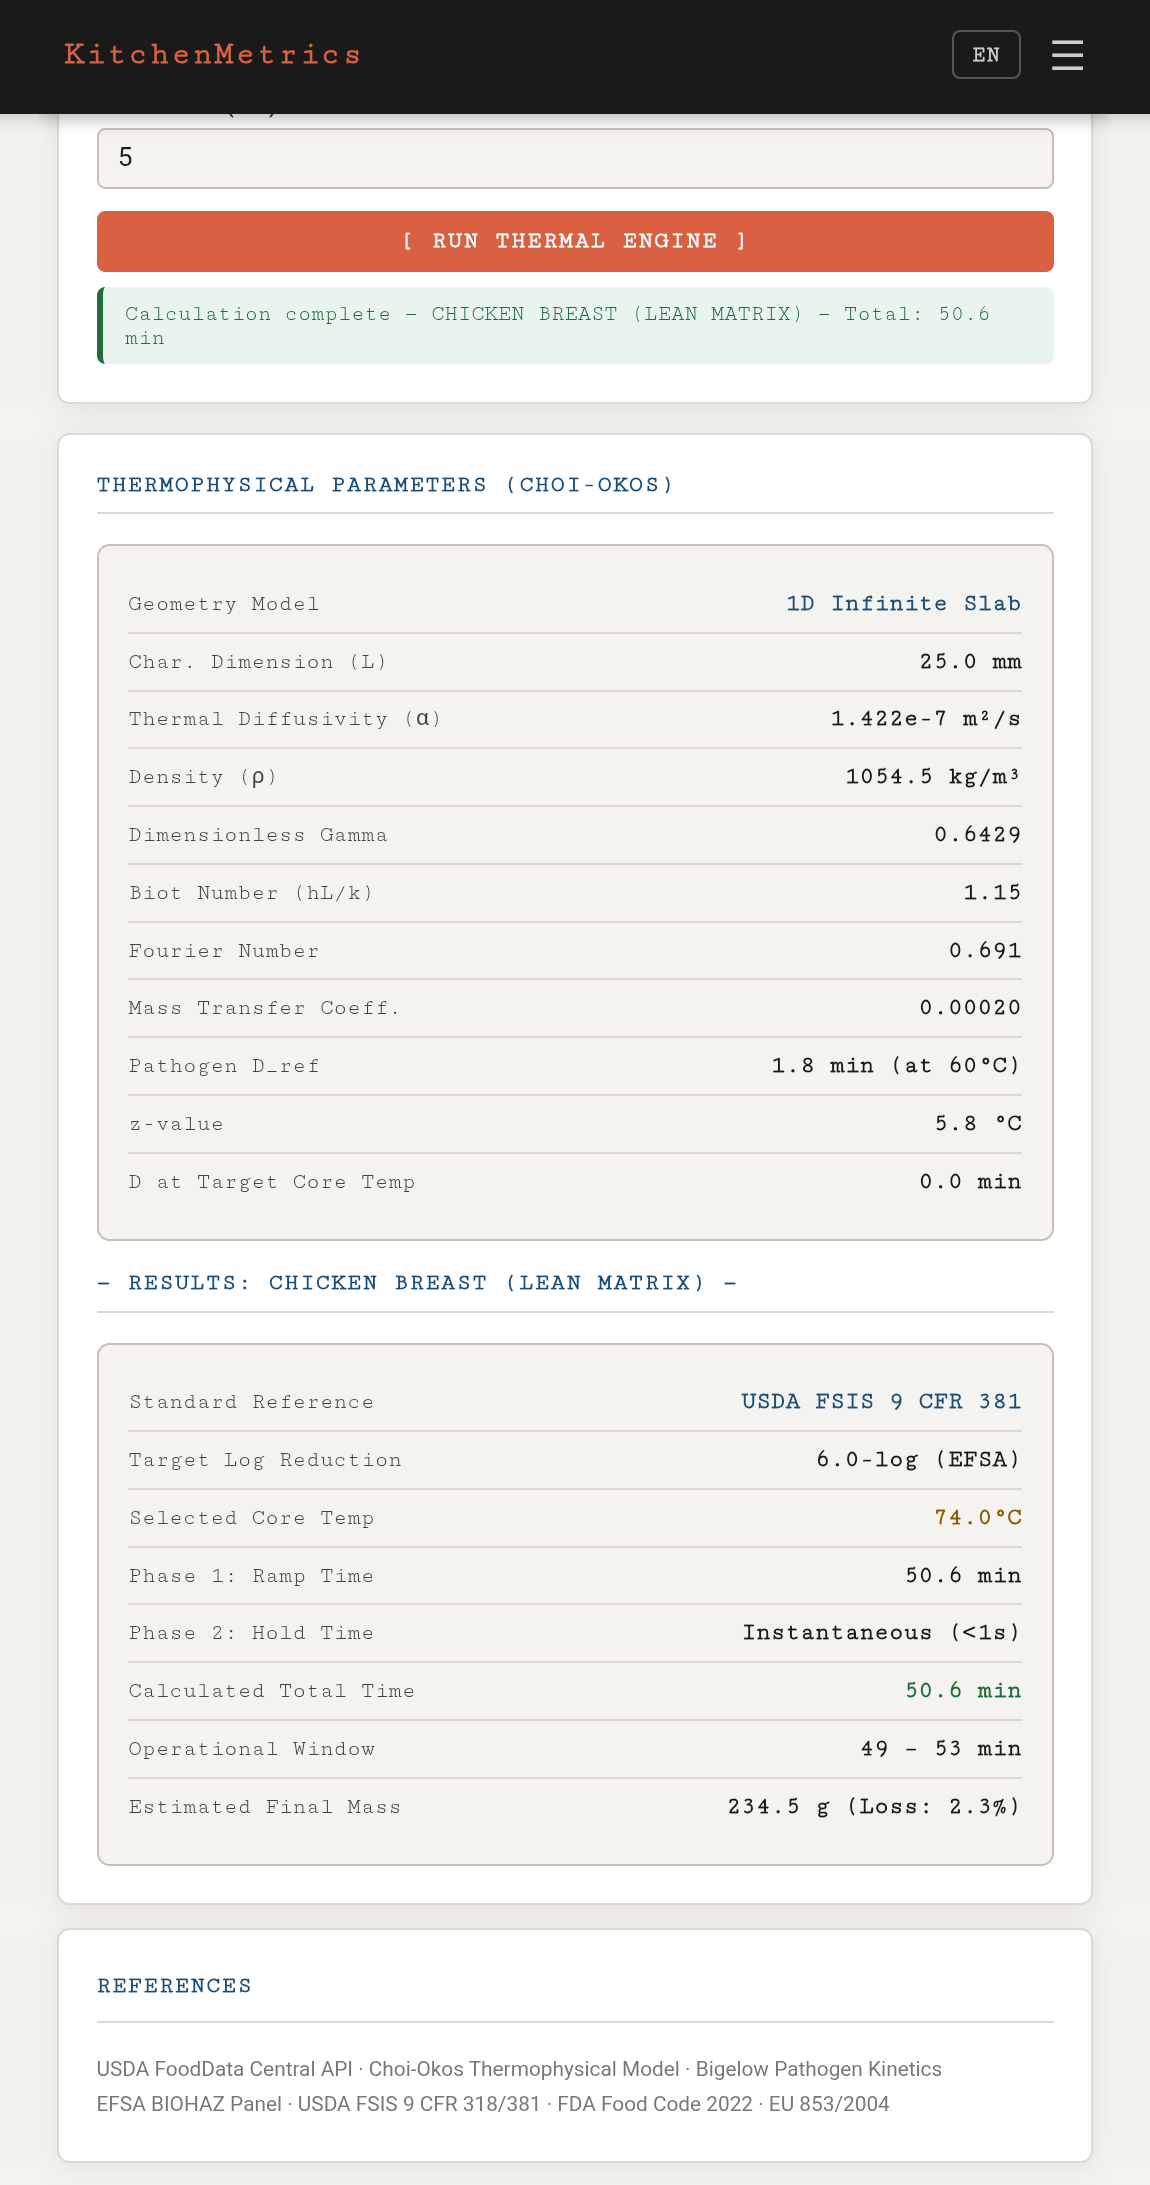
| Thermal Cooking Calculator | Ramp and hold times from the Choi-Okos model and Bigelow pathogen kinetics, 6-log reduction, 1108 food profiles. |
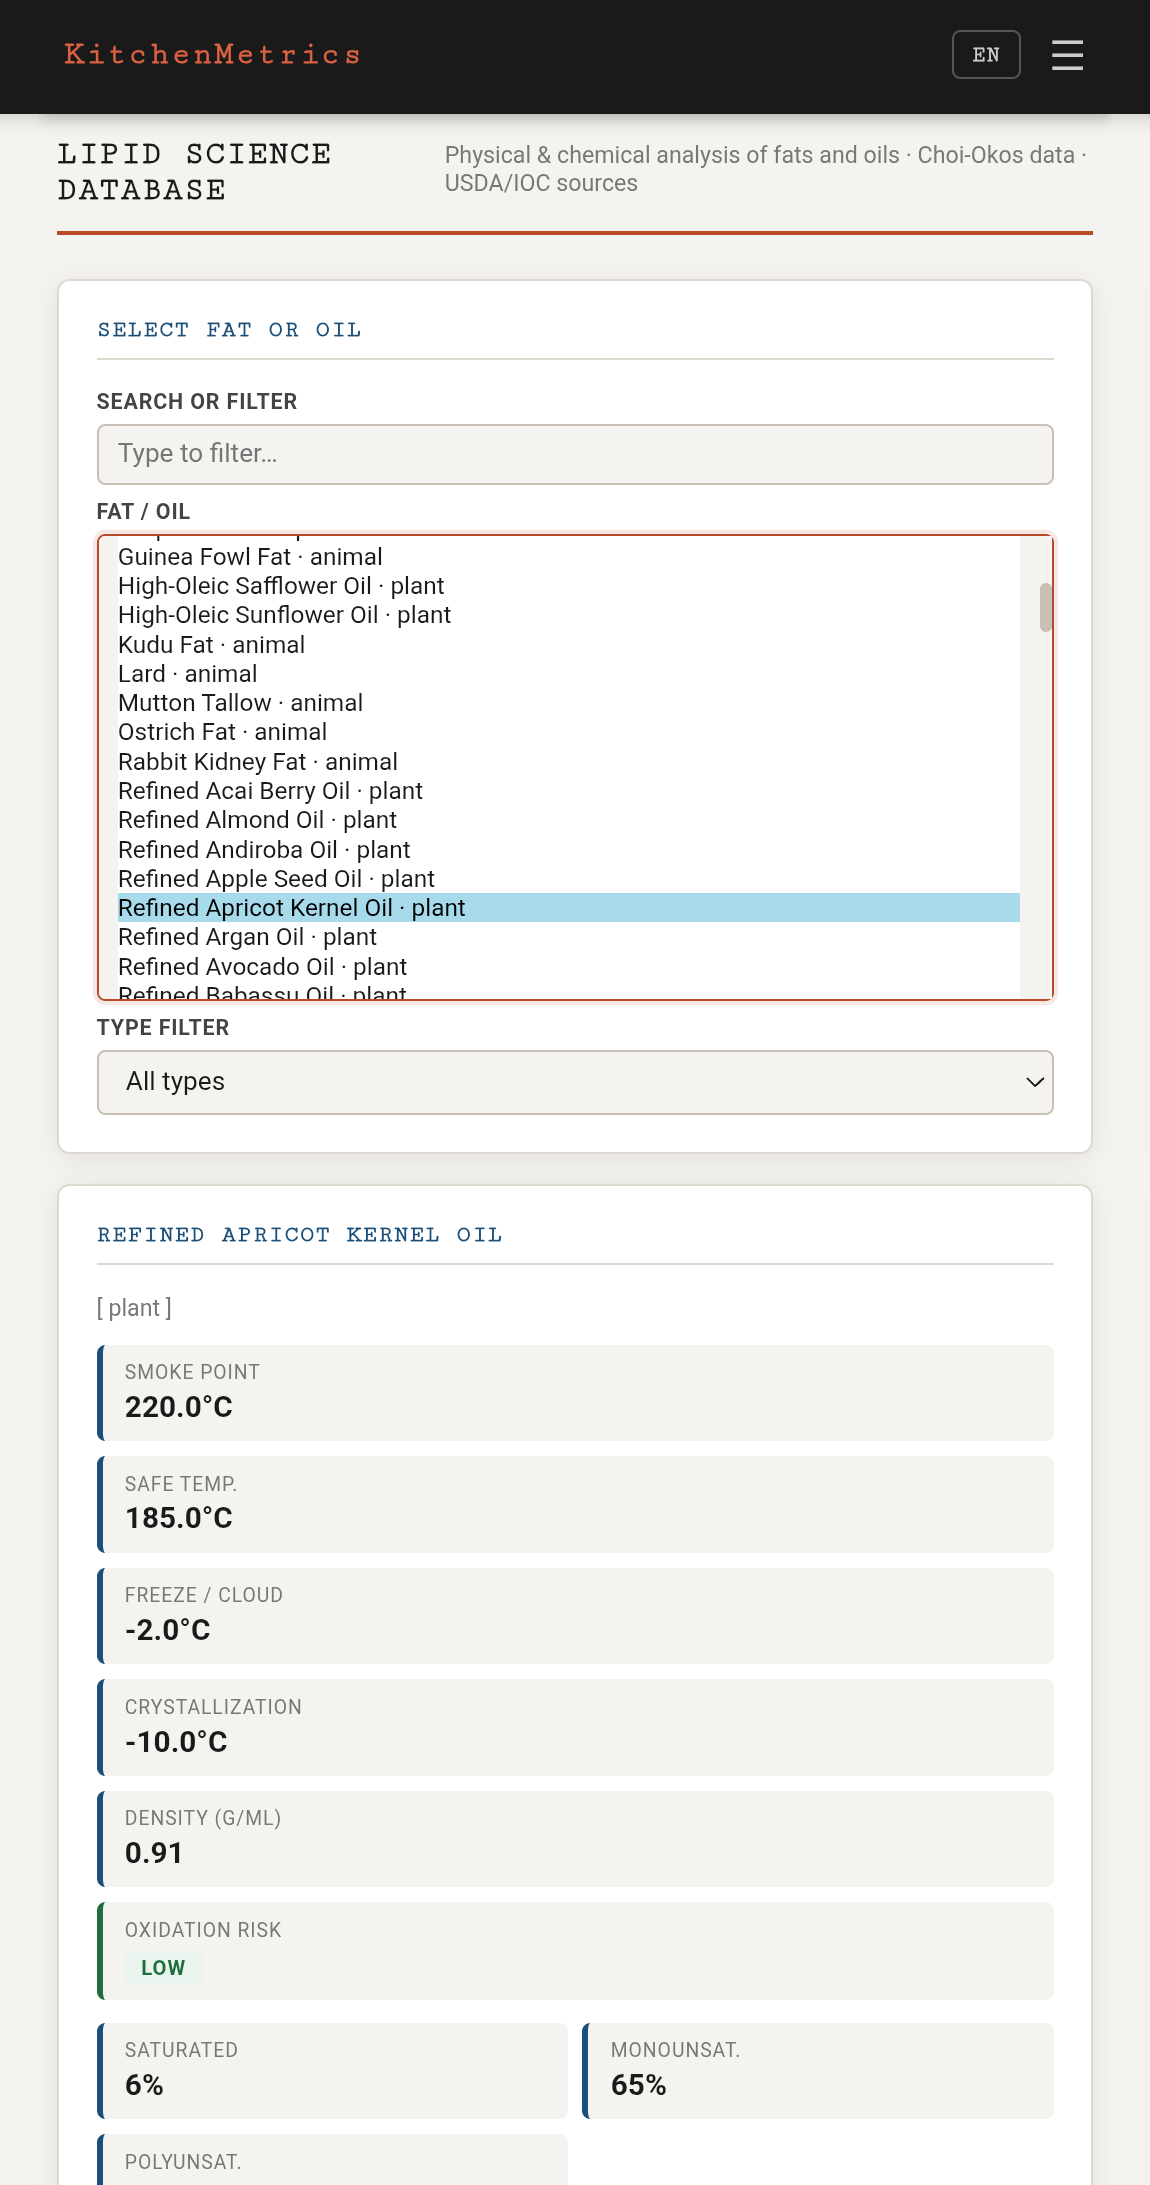
| Lipid Science Database | 148 fats and oils: smoke point, safe temperature, crystallisation, density, fatty-acid profile, oxidation risk, allergens. Two disclosed defects: the attribution field names a journal or an organisation rather than a document (40 distinct strings, one carrying a year), and the crystallisation column holds a temperature on 135 rows and a crystal habit on the other 13. Both are stated in the app rather than tidied away. |
| Physical Screen Ruler | DPI-calibrated ruler in cm and inches. |
The costing model
KitchenMetrics follows the Uniform System of Accounts for Restaurants (USAR), the standard published by the National Restaurant Association.
Two yields, applied in sequence. Conflating them undercosts every cooked item:
EP €/kg      = AP €/kg ÷ (butchering yield %  / 100)     # trim, bone, peel
raw g needed = plated g ÷ (1 − cooking loss % / 100)     # evaporation, rendering
food cost    = EP €/kg × (raw g ÷ 1000)
A 200 g plated salmon portion at 65% butchering yield and 18% cooking loss needs 244 g of EP fish, not 200 g.
Ratios are measured on net revenue — VAT is collected for the state, not earned:
Food Cost %  = food cost       ÷ net price × 100
Prime Cost % = (food + labour) ÷ net price × 100      # USAR headline · target < 65%
Repricing works against your real menu price. If a price is only ever derived from a target food cost, the ratio equals the target by construction and can never break. KitchenMetrics stores the price actually printed on your menu, so a supplier increase shows the true margin hit — and the price you’d need to recover it.
Honest limitations
- The energy load factor defaults to 0.45 — an estimate, not a measurement. It is the one number in the app not grounded in a published source. Measure yours with a plug meter.
- KitchenMetrics is a professional estimation tool. Always verify critical food-safety parameters against your own HACCP plan and local regulations.
Sources
USDA FoodData Central · USDA FSIS 9 CFR 318/381 · EFSA BIOHAZ Panel · FDA Food Code 2022 · EU 853/2004 · Choi-Okos thermophysical model · Bigelow pathogen kinetics · International Olive Council · AOCS Lipid Library · Uniform System of Accounts for Restaurants · national TPC regulations (see SOURCES.md for the full per-figure mapping)
Privacy
No data collection, no analytics, no advertising, no accounts. The app requests zero Android permissions — not even INTERNET — so nothing you type can leave your device: the guarantee is enforced by the operating system, not promised by a policy.
Sources & verification
SOURCES.md maps every figure the app prints to its published origin — national regulations for the fryer limits, USDA/IOC/AOCS and peer-reviewed literature for the fat database, Choi–Okos and Bigelow for the thermal model, USAR for the costing — plus an honest list of what is estimated rather than sourced. Verify anything; don’t take our word.
For developers
- Changelog — what shipped in 1.0, and what has changed since. Most entries are corrections, recorded with the reason: a correction without its reason teaches nobody anything.
- Developer Brief — EN + IT — architecture, domain models, test strategy, and the journey from a Python exercise to a signed Play release in two and a half months.
- Engineering Notes — case study of the highest-severity bug found in the pre-release audit (a thermal model wrong in the dangerous direction) and how it was caught.
This repository hosts the documentation, privacy policy and release notes.
The application source is maintained privately.